
Oldham council’s local plan is being revised so it can be lined up with the wider Greater Manchester devolution spatial framework plans. Strategic bias and the manipulation of facts is a well worn tactic of Labour Oldham. They deploy every devious half-truth from lauding their business acumen by calling businesses new to an area when they move a few hundred yards to championing a youthful population while making no reference to the migration that seeds it nor one of the UK’s largest benefit bills that sustains it. This theme of half-truth facts and statistics continues in the local plan where only people over 65 are targeted as putting pressure on services as the council quotes skewed averages and inaccurate national comparisons.
Taken from Oldham council local plan 2017
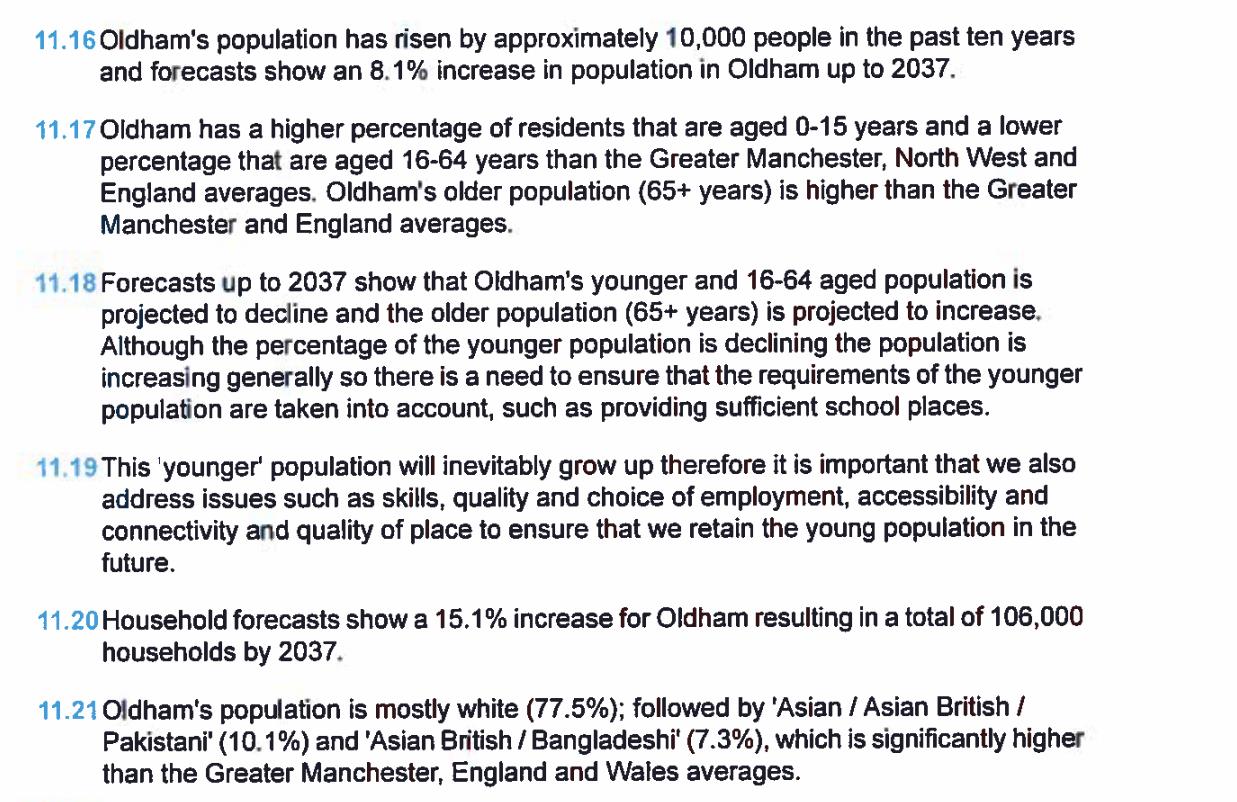
Oldham council claim: ” Oldham’s population has risen by approximately 10,000 people in the past ten years”
Oldham’s main driver of population increase is migration followed by high fertility communities. As to be expected by a Labour Oldham document no reference to ongoing record levels of migration is made in the report. Oldham’s 10,000 population increase would be far higher but in 2016 alone 756 more Oldham residents moved away from Oldham than came to Oldham from other local authority areas. What is clear is that Oldham’s population is changing and so-called “white flight” away from Oldham is a reality although we would expect that with the huge increase in unskilled eastern European migrants Oldham residents of Asian heritage are also leaving.
Oldham council claim: “Oldham has an higher percentage of residents 0-15 years than Greater Manchester, Northwest and England averages”
Oldham has a higher percentage of residents aged 0-15 than every other local authority in Greater Manchester, more than the North West, England, Scotland, Wales and Northern Ireland averages. 22.6% of the current Oldham population are 0-15 years of age which is almost a quarter of Oldham’s population born in one fifteen year period. OAP’s span a time-frame of over 40 years and currently make up 15.8% of the Oldham population. Between the years 2069 and 2084 almost a third of the entire current populations of St Mary’s, Werneth, Coldhurst and Alexandra will retire in one fifteen year period.
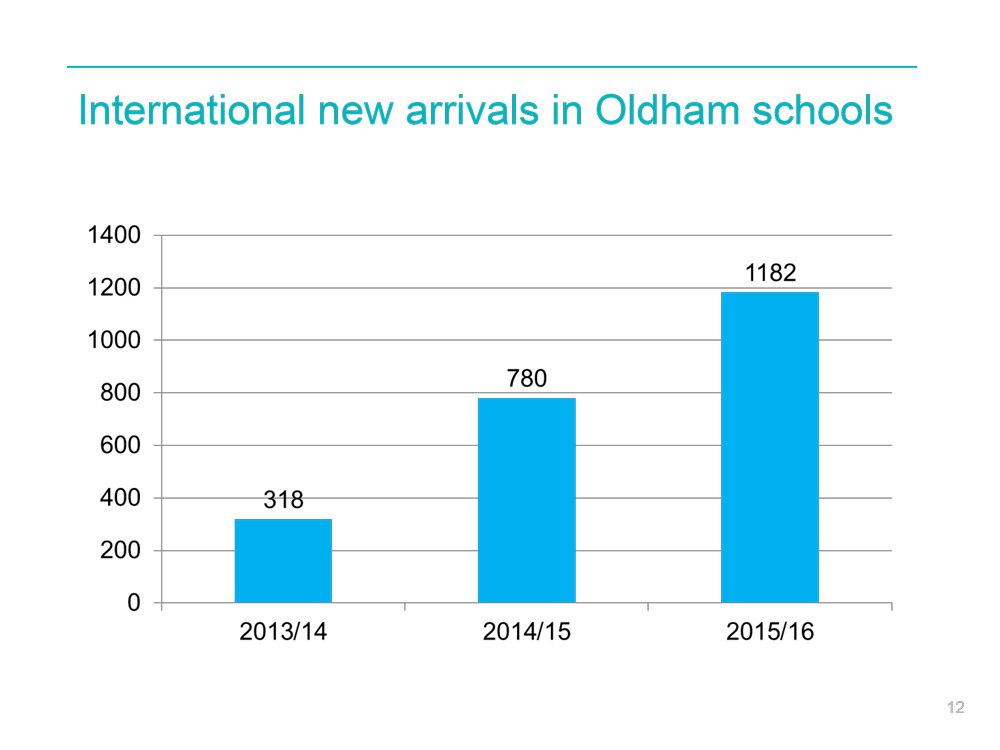
Taken from the “Link Governor Network Meeting” document, pressure from migrant families on Oldham schools.
Oldham council also claim that the number of young people and those under 65 will fall and the number of OAP’s will increase.
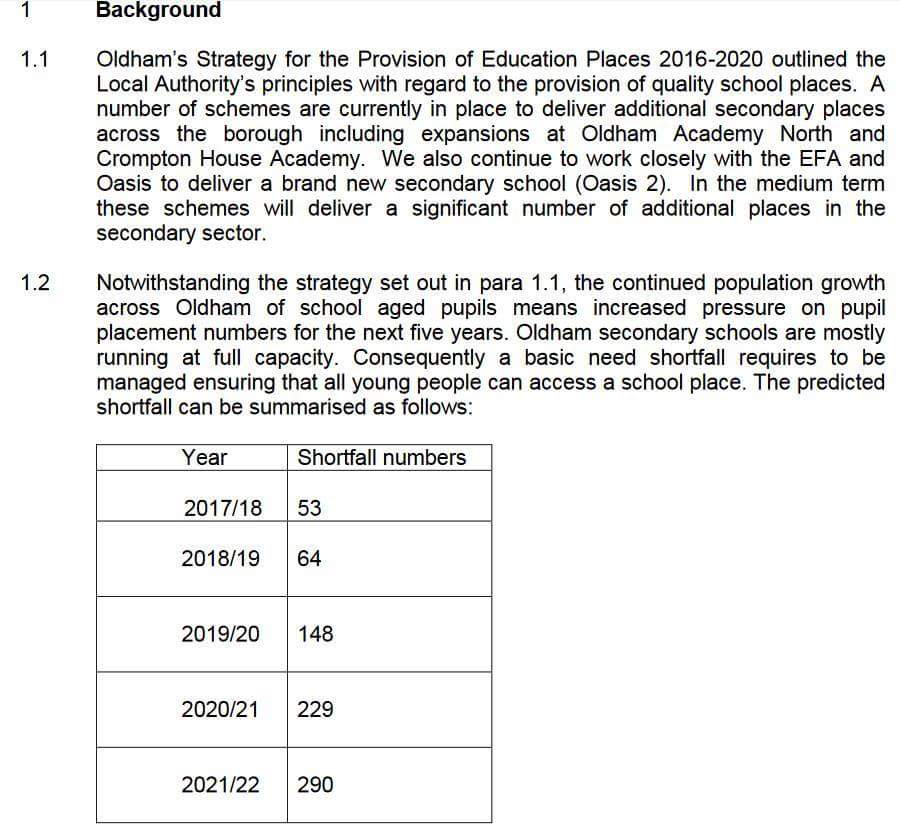
This is directly contradicted by the council’s five year plan to deal with pupil place shortfalls in local schools. Oldham’s high fertility communities are expanding and future immigration patterns after Brexit are impossible to predict.
Oldham council’s plan to use the vacant UTC building to address the increase in pupils
Oldham council claim: “Oldham’s older population (65+ years) is higher than the Greater Manchester and England averages”
The Greater Manchester average is greatly skewed by the inclusion of the university city of Manchester and to a lesser degree Salford. These cities have fewer OAP’s because of student numbers and unsuitable city centre housing and these are the only two of the ten Greater Manchester authority areas with less OAP’s than Oldham. Bolton, Bury, Rochdale, Stockport, Tameside, Trafford and Wigan all have considerably more OAP’s than Oldham. 17.9% of the population of England are 65 or older whereas 15.8% of the Oldham population are 65 or older which makes Oldham’s aged population 11.7% lower than England’s. The numbers of OAP’s in Oldham has fallen for the last two years
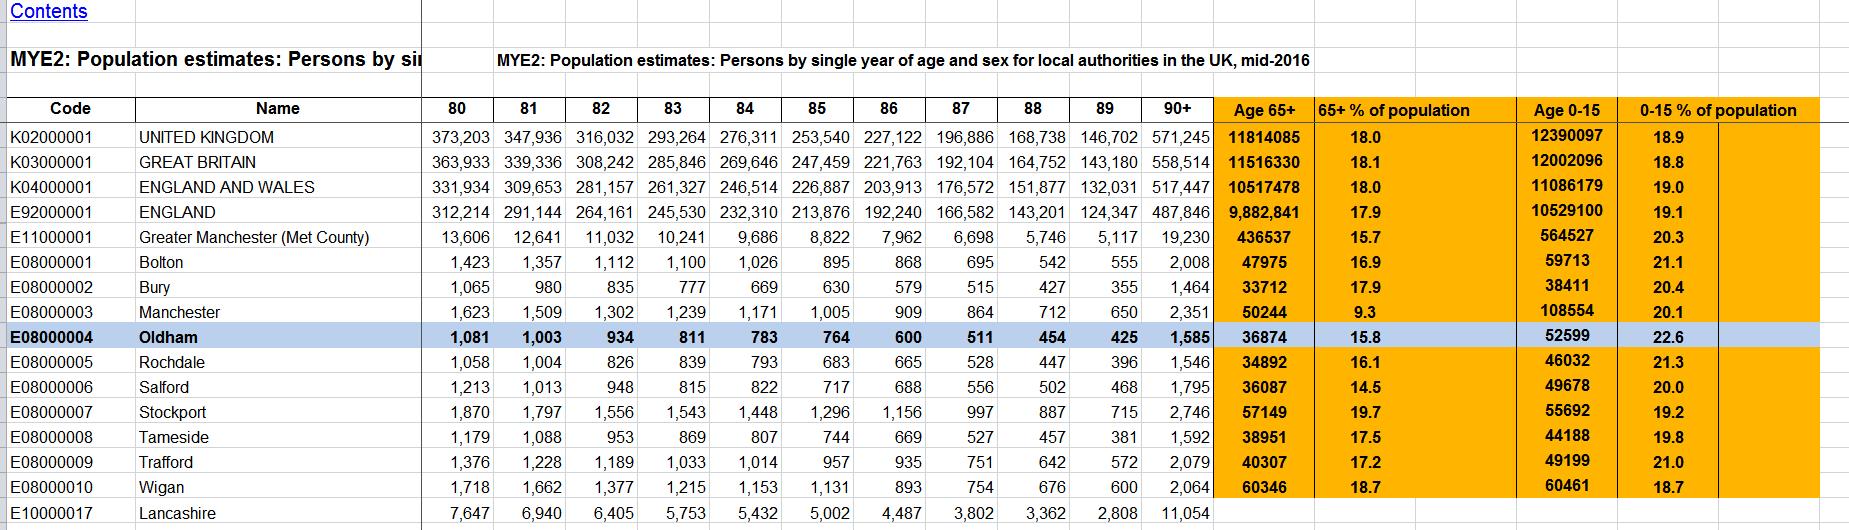
Population statistics 2016 age group and percentages
Oldham council’s revue of the local plan is available on the council website